
Toolbar
The toolbar is the strip below the main menu. It holds the playback controls and a few display and diagnostic toggles.

Mute
The Mute checkbox on the left silences all game audio.
Playback controls
In the center are the game controls — the same actions as the Game menu (see the Main Menu):
Play / Stop (
Ctrl+P) — start or stop the game. Play is disabled while the scripts have no successfully compiled program to run.Pause (
Ctrl+Shift+P) — pause or resume the game. If a code change fails to compile while the game is running, the game pauses automatically and cannot be resumed until the compilation errors are fixed.Next Frame (
Ctrl+Alt+P) — advance the game by one frame; available only while it is running.
Display
The Display button opens a popup of rendering and debug-visualization options. The physics, shading, lighting, and bounds sections appear when a Scene or Prefab viewport is active; the G-buffer options and Reset are always available.
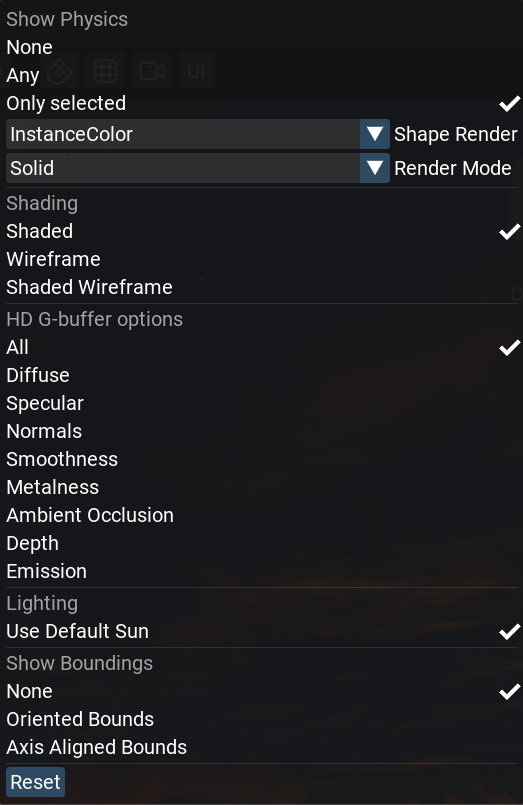
Show Physics — how much collision geometry to draw over the scene, as a debugging aid for checking colliders: None (off), Any (every body), or Only selected (only the selected node’s bodies).
Shape Render — the color scheme for those collision shapes, so you can tell bodies apart by a chosen property: by instance, shape type, motion type (static / keyframed / dynamic), sleep state, simulation island, physics material, or collision layer. Each option’s tooltip spells out the colors it uses.
Render Mode — how the collision shapes are drawn: Solid or Wireframe, each optionally with Depth Fade (parts behind scene geometry fade out instead of being hidden).
Shading — how the scene itself is rendered: Shaded (normal), Wireframe, or Shaded Wireframe (a wireframe overlay on the shaded image).
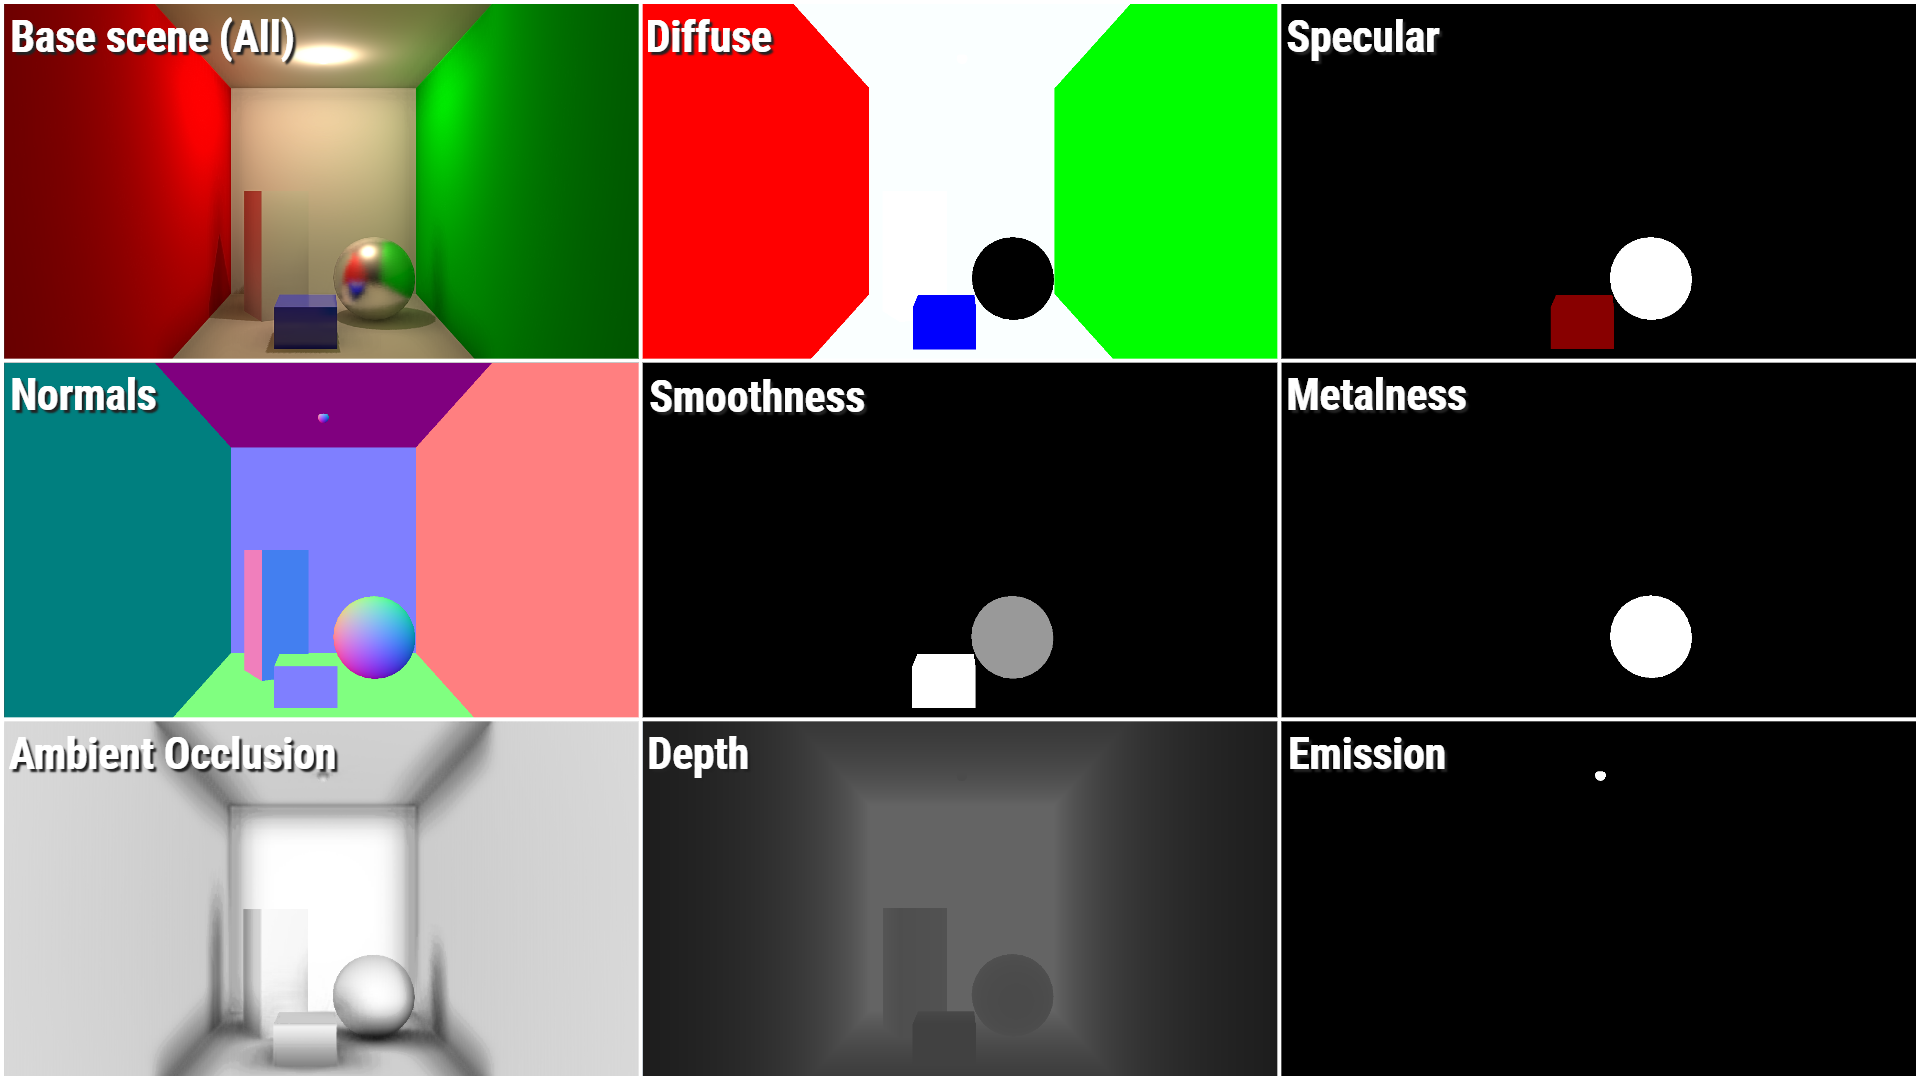
G-buffer options — show a single channel of the deferred G-buffer instead of the final image, to inspect what the renderer wrote for each surface. All is the normal view; the other channels (Diffuse, Specular, Normals, Roughness, Ambient Occlusion, and so on) are shown in the figure below. HD rendering exposes a slightly different set, adding Smoothness, Metalness, Depth, and Emission.
Use Default Sun — light the scene with a built-in sun direction when it contains no directional light, so an otherwise unlit scene is still visible.
Show Boundings — draw object bounding volumes for debugging extents and culling: None, Oriented Bounds (aligned to the object), or Axis Aligned Bounds (aligned to the world).
Reset — restore all of the above to their defaults.
The G-buffer channels, side by side:
Changes made here are undoable.
Stats
The Stats button toggles the Statistics overlay.
Debugger and Daslang Profiler
The Debugger and Daslang Profiler indicators each show a dot — green when enabled, dimmed when disabled. Click one to open its settings popup. See Debugger and Daslang Profiler for details. The Daslang Profiler toggles per-function instrumentation of your Daslang code for the external daProfiler application; it is unrelated to the built-in Profiler window opened from Window ▸ Profiler.