Memory Profiler
Integration
Add
require engine.runtime.memory_profilerline to main scriptPlay the game
Exit the game or reload the script (
ctrl-shift-x), profiling results will be printed to the log file
Usage
Open the log file in the game folder and find the line with memory used by context text. This line contains information about the total heap allocated by the script and the string heap allocated by the script. After that you can find the table with detailed information about a heap allocated by each function.
Result sample
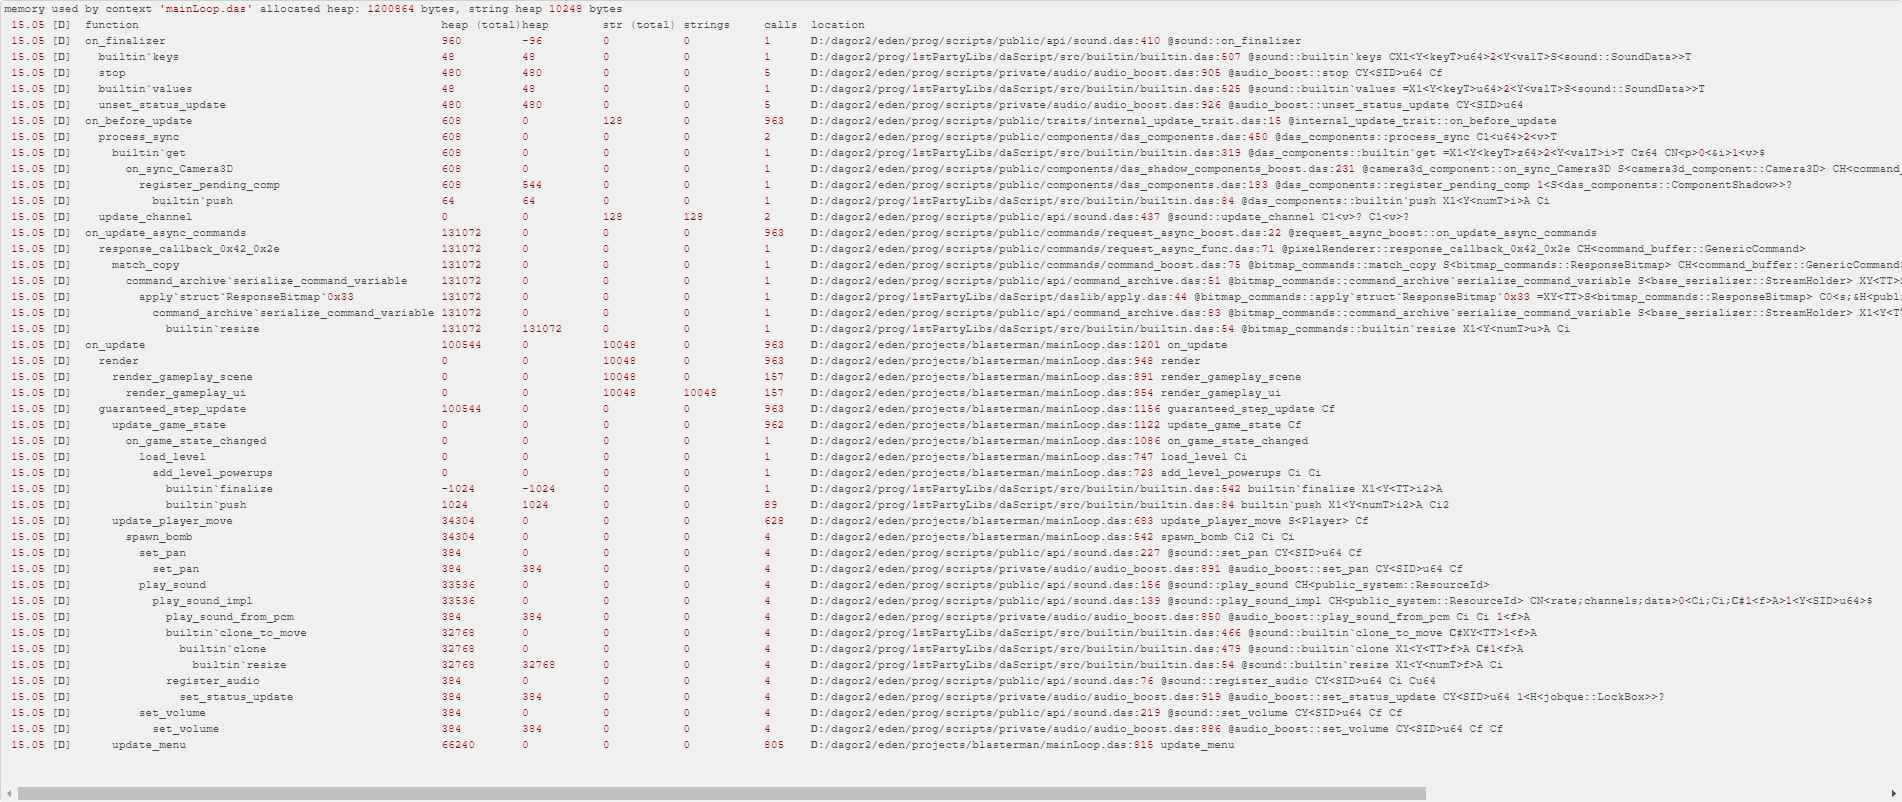
Table columns
function- the function nameheap (total)- a heap allocated by the function including its subfunctionsheap- a heap allocated by the function excluding its subfunctionsstr (total)- a string heap allocated by the function including its subfunctionsstrings- a string heap allocated by the function excluding its subfunctionscalls- a number of calls of the functionlocation- the location of function in the script file, line and function name