
Performance Monitoring
The editor has two built-in tools for watching runtime performance, both fed by the same lightweight per-frame counters:
The Statistics overlay — a compact, always-current snapshot of memory, scene render load, and frame timing.
The Profiler window — those same figures plotted as scrolling graphs over the last couple of thousand frames, for spotting trends and spikes rather than a single instant.
Note
Both are distinct from the external daProfiler application and the editor’s Daslang Profiler toggle (which instruments individual Daslang functions so they appear in daProfiler). If you need per-function Daslang timings rather than high-level frame counters, see daProfiler.
Statistics overlay
The Statistics overlay is a real-time, semi-transparent overlay in the top-right corner of the viewport. Toggle it with the Stats button in the editor toolbar. It is shown both in the editor and in the running game (while playing). In the editor it is interactive and includes Reset all frametimes and Open Profiler buttons; in-game it is display-only.
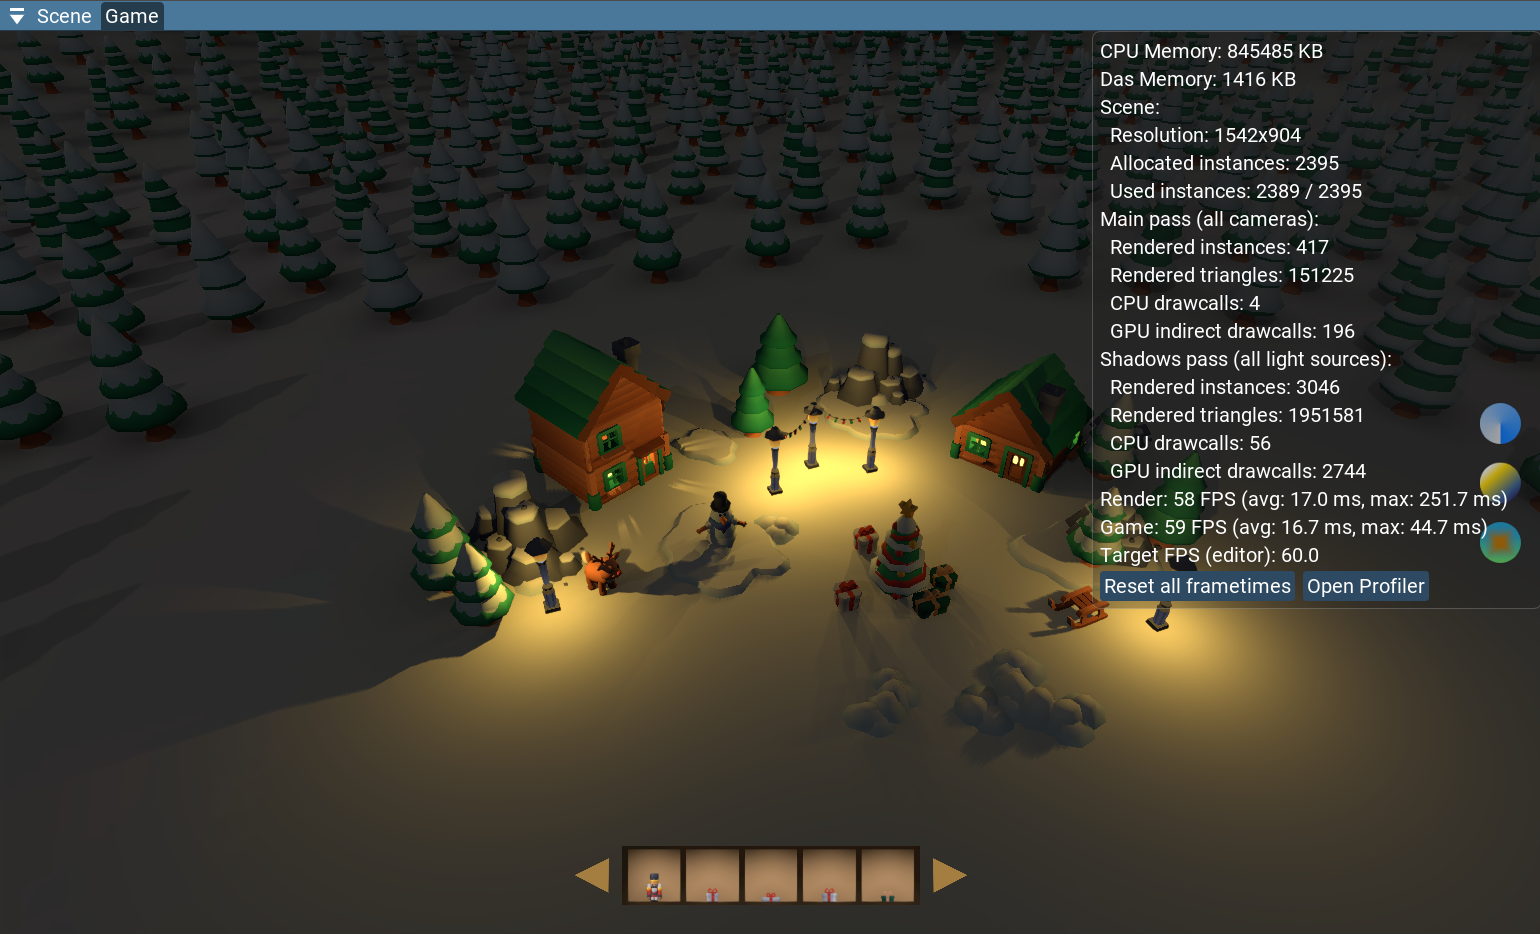
The overlay groups its readings into the sections below. The render-pass sections appear only when that pass actually draws something, so an empty scene or one without shadow-casting lights will omit them.
Memory
CPU Memory — total RAM, in kilobytes, currently allocated by the process.
Das Memory — memory, in kilobytes, used by the Daslang script context (string heap plus object heap). Use the
gc.*console commands to reclaim unused script memory.
Scene
Resolution — the current render resolution, in pixels (
width x height).Allocated instances — the number of render-instance slots currently reserved.
Used instances — instances that survive CPU-side culling and are submitted to draw, shown as
used / allocated.
Main pass (all cameras)
Geometry submitted for the main color pass, summed across every active camera:
Rendered instances — number of object instances drawn.
Rendered triangles — number of triangles drawn.
CPU drawcalls — draw calls issued by the CPU.
GPU indirect drawcalls — draw calls issued through the GPU-driven (indirect) path.
Shadows pass (all light sources)
The same four metrics as the main pass, but counting geometry rendered into the shadow maps of all shadow-casting light sources.
Frame timing
Render — frames per second of the render thread, with the average and maximum frame time of recent frames, in milliseconds:
Render: <fps> FPS (avg: <ms> ms, max: <ms> ms).Game — the same, measured for the game (update) thread. The render and game threads run independently, so these two figures can differ.
Target FPS — the configured upper limit for the frame rate (set via
app.set_target_fps). In the editor this is capped at 60 and labelled Target FPS (editor).Reset all frametimes (editor only) — a button that clears the accumulated maximum frame-time values, so the timings start measuring again from the next frame.
Open Profiler (editor only) — opens the Profiler graphs window described below.
Profiler graphs
The Profiler window plots the overlay’s counters as scrolling graphs of roughly the last 2,000 frames, so you can see how a value trends or where spikes occur instead of only its value in a single instant. Open it from Window ▸ Profiler in the main menu, or with the Open Profiler button on the Statistics overlay.
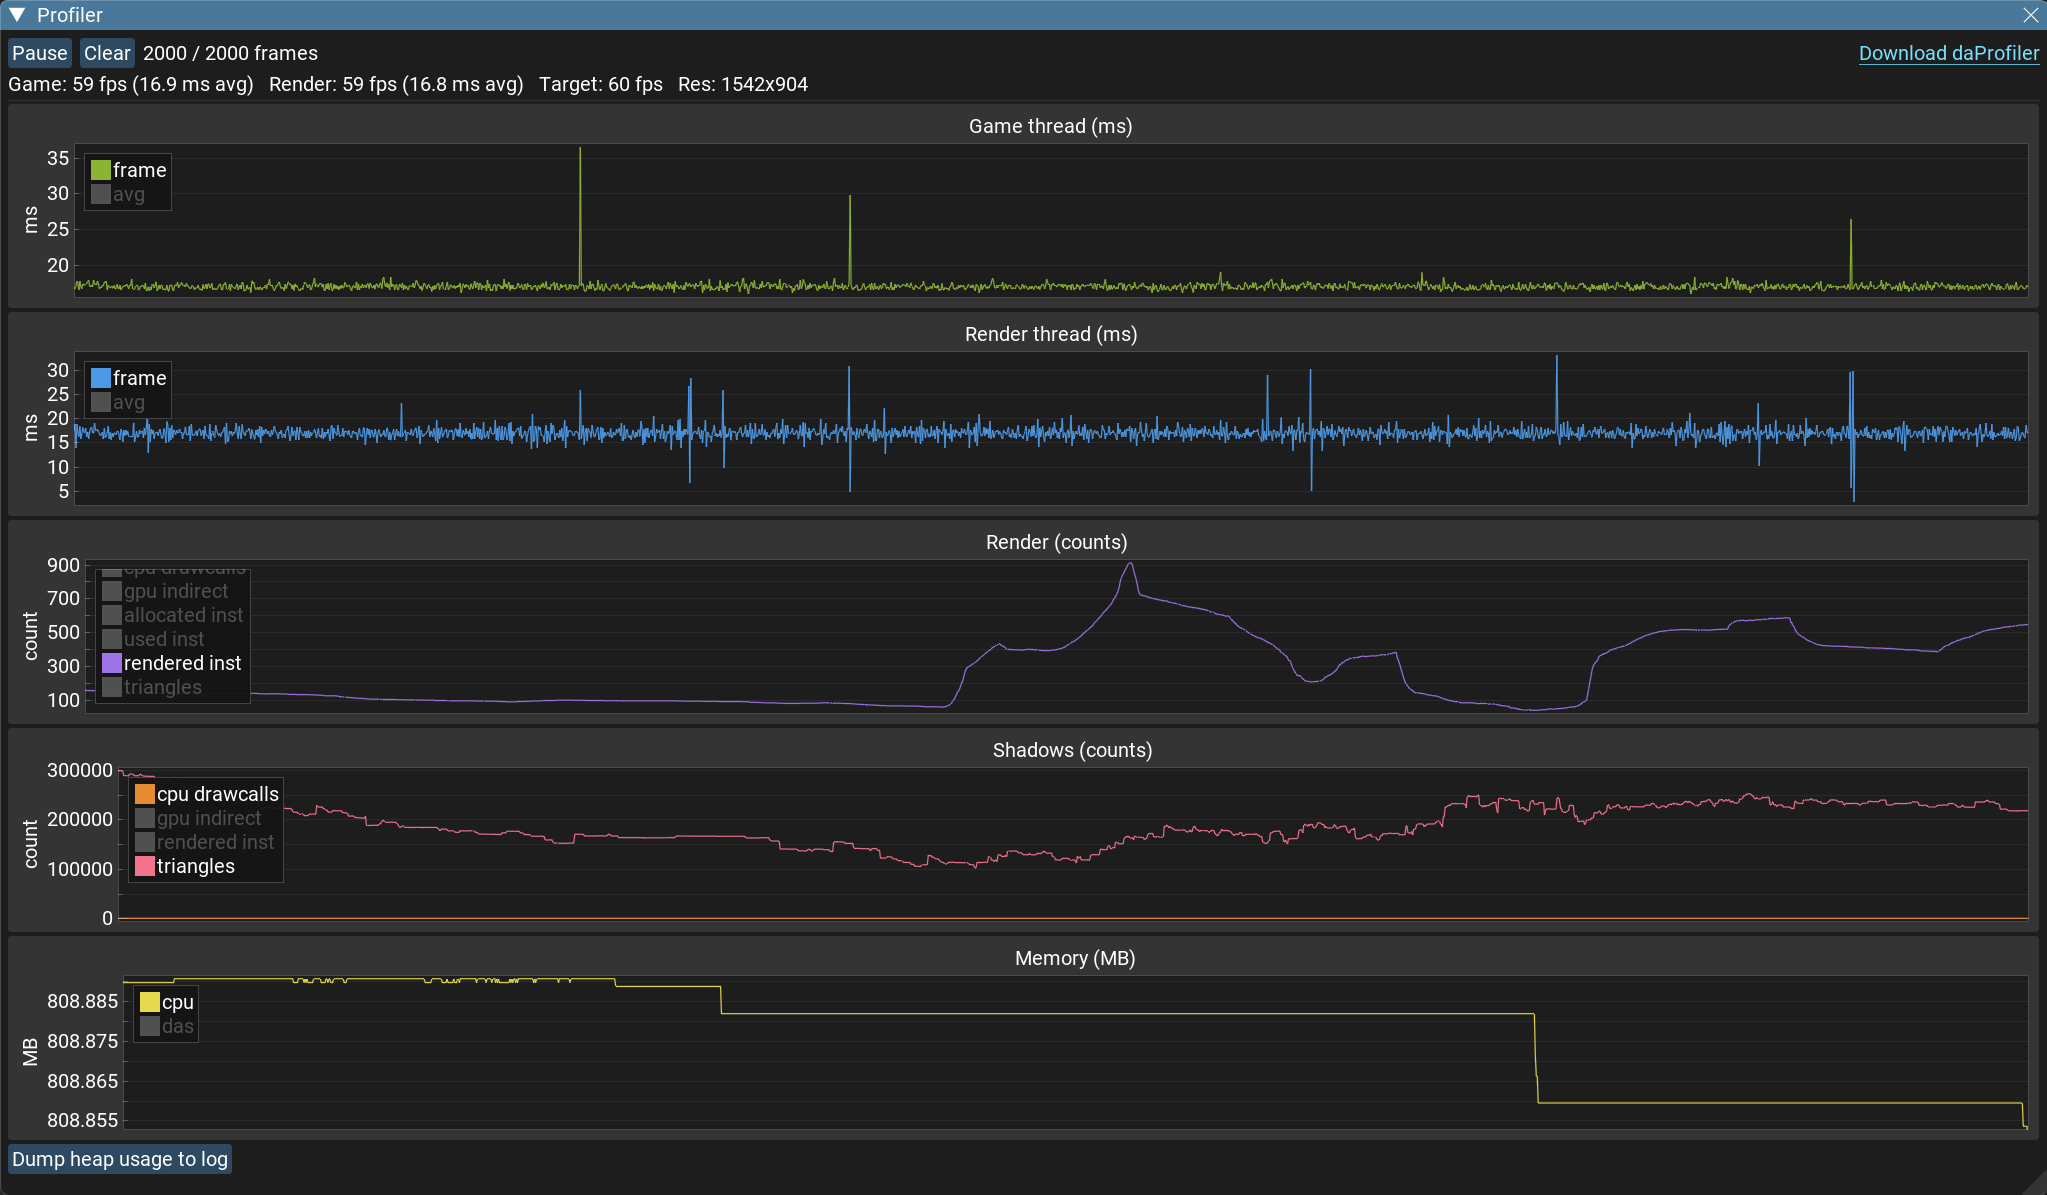
A header line reports the average game and render FPS and frame time, the target FPS, and the resolution. The two frame-time graphs plot the raw per-frame timing (so short hitches and spikes are visible) with the smoothed average overlaid as a second line for reference. Below the header are five stacked graphs:
Game thread (ms) — per-frame game thread time, plus its average.
Render thread (ms) — per-frame render thread time, plus its average.
Render (counts) — main-pass draw calls, instances, and triangles (see the funnel note below).
Shadows (counts) — the same counts for the shadow passes.
Memory (MB) — CPU and Daslang script memory.
Each graph can hold several series; click an entry in its legend to show or hide that line. Large-scale series such as triangle counts or allocated instances start hidden so they do not flatten the rest — click them in the legend to bring them in. The vertical axis auto-fits the visible series (with a little headroom).
The controls along the top of the window:
Pause / Resume — stop and restart sampling. Recorded history is kept while paused.
Clear — discard all recorded history.
The frame counter (
<n> / <total>) shows how much of the history buffer is filled.
A Dump heap usage to log button sits just below the Memory graph; it writes the largest
Daslang global allocations to the log, the same as the gc.print_heap_usage console command.
Note
The instance counts form a funnel: allocated >= used >= rendered. Allocated is every instance slot in the scene, used is what survives CPU-side culling and is submitted to draw, and rendered is what the GPU actually draws after its own culling. Toggling all three in the legend shows how much each culling stage removes.
Note
A lightweight FPS counter (without the full breakdown) can be shown separately via the Fps info string mode setting in Preferences.