daProfiler
Note
This page covers the external daProfiler application and the editor’s Daslang Profiler toggle. For the editor’s built-in statistics overlay and frame-time/counter graphs (the Window ▸ Profiler window), see Performance Monitoring.
daProfiler is a standalone external application (Windows) that connects to EdenSpark and profiles it. It can be downloaded from: https://github.com/GaijinEntertainment/daProfiler/releases
The editor’s Daslang Profiler toggle is a separate layer on top: it instruments your
individual Daslang functions so they show up in daProfiler, each prefixed with das:. Enable it
only when you want per-function Daslang timings — daProfiler still works with it off, you just
won’t see your own Daslang functions broken out.
Using Editor Settings
Enable per-function Daslang instrumentation from the editor:
In the editor toolbar, click the Daslang Profiler button
Check Enable Daslang Profiler and click Apply
The game will reload with Daslang instrumentation enabled
The indicator shows whether Daslang instrumentation is active (green = enabled, gray = disabled).
Usage
Download daProfiler
Integrate the profiler into your Daslang script
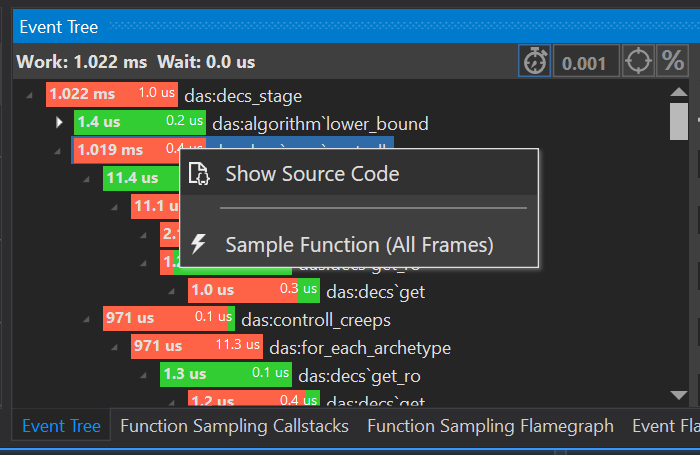
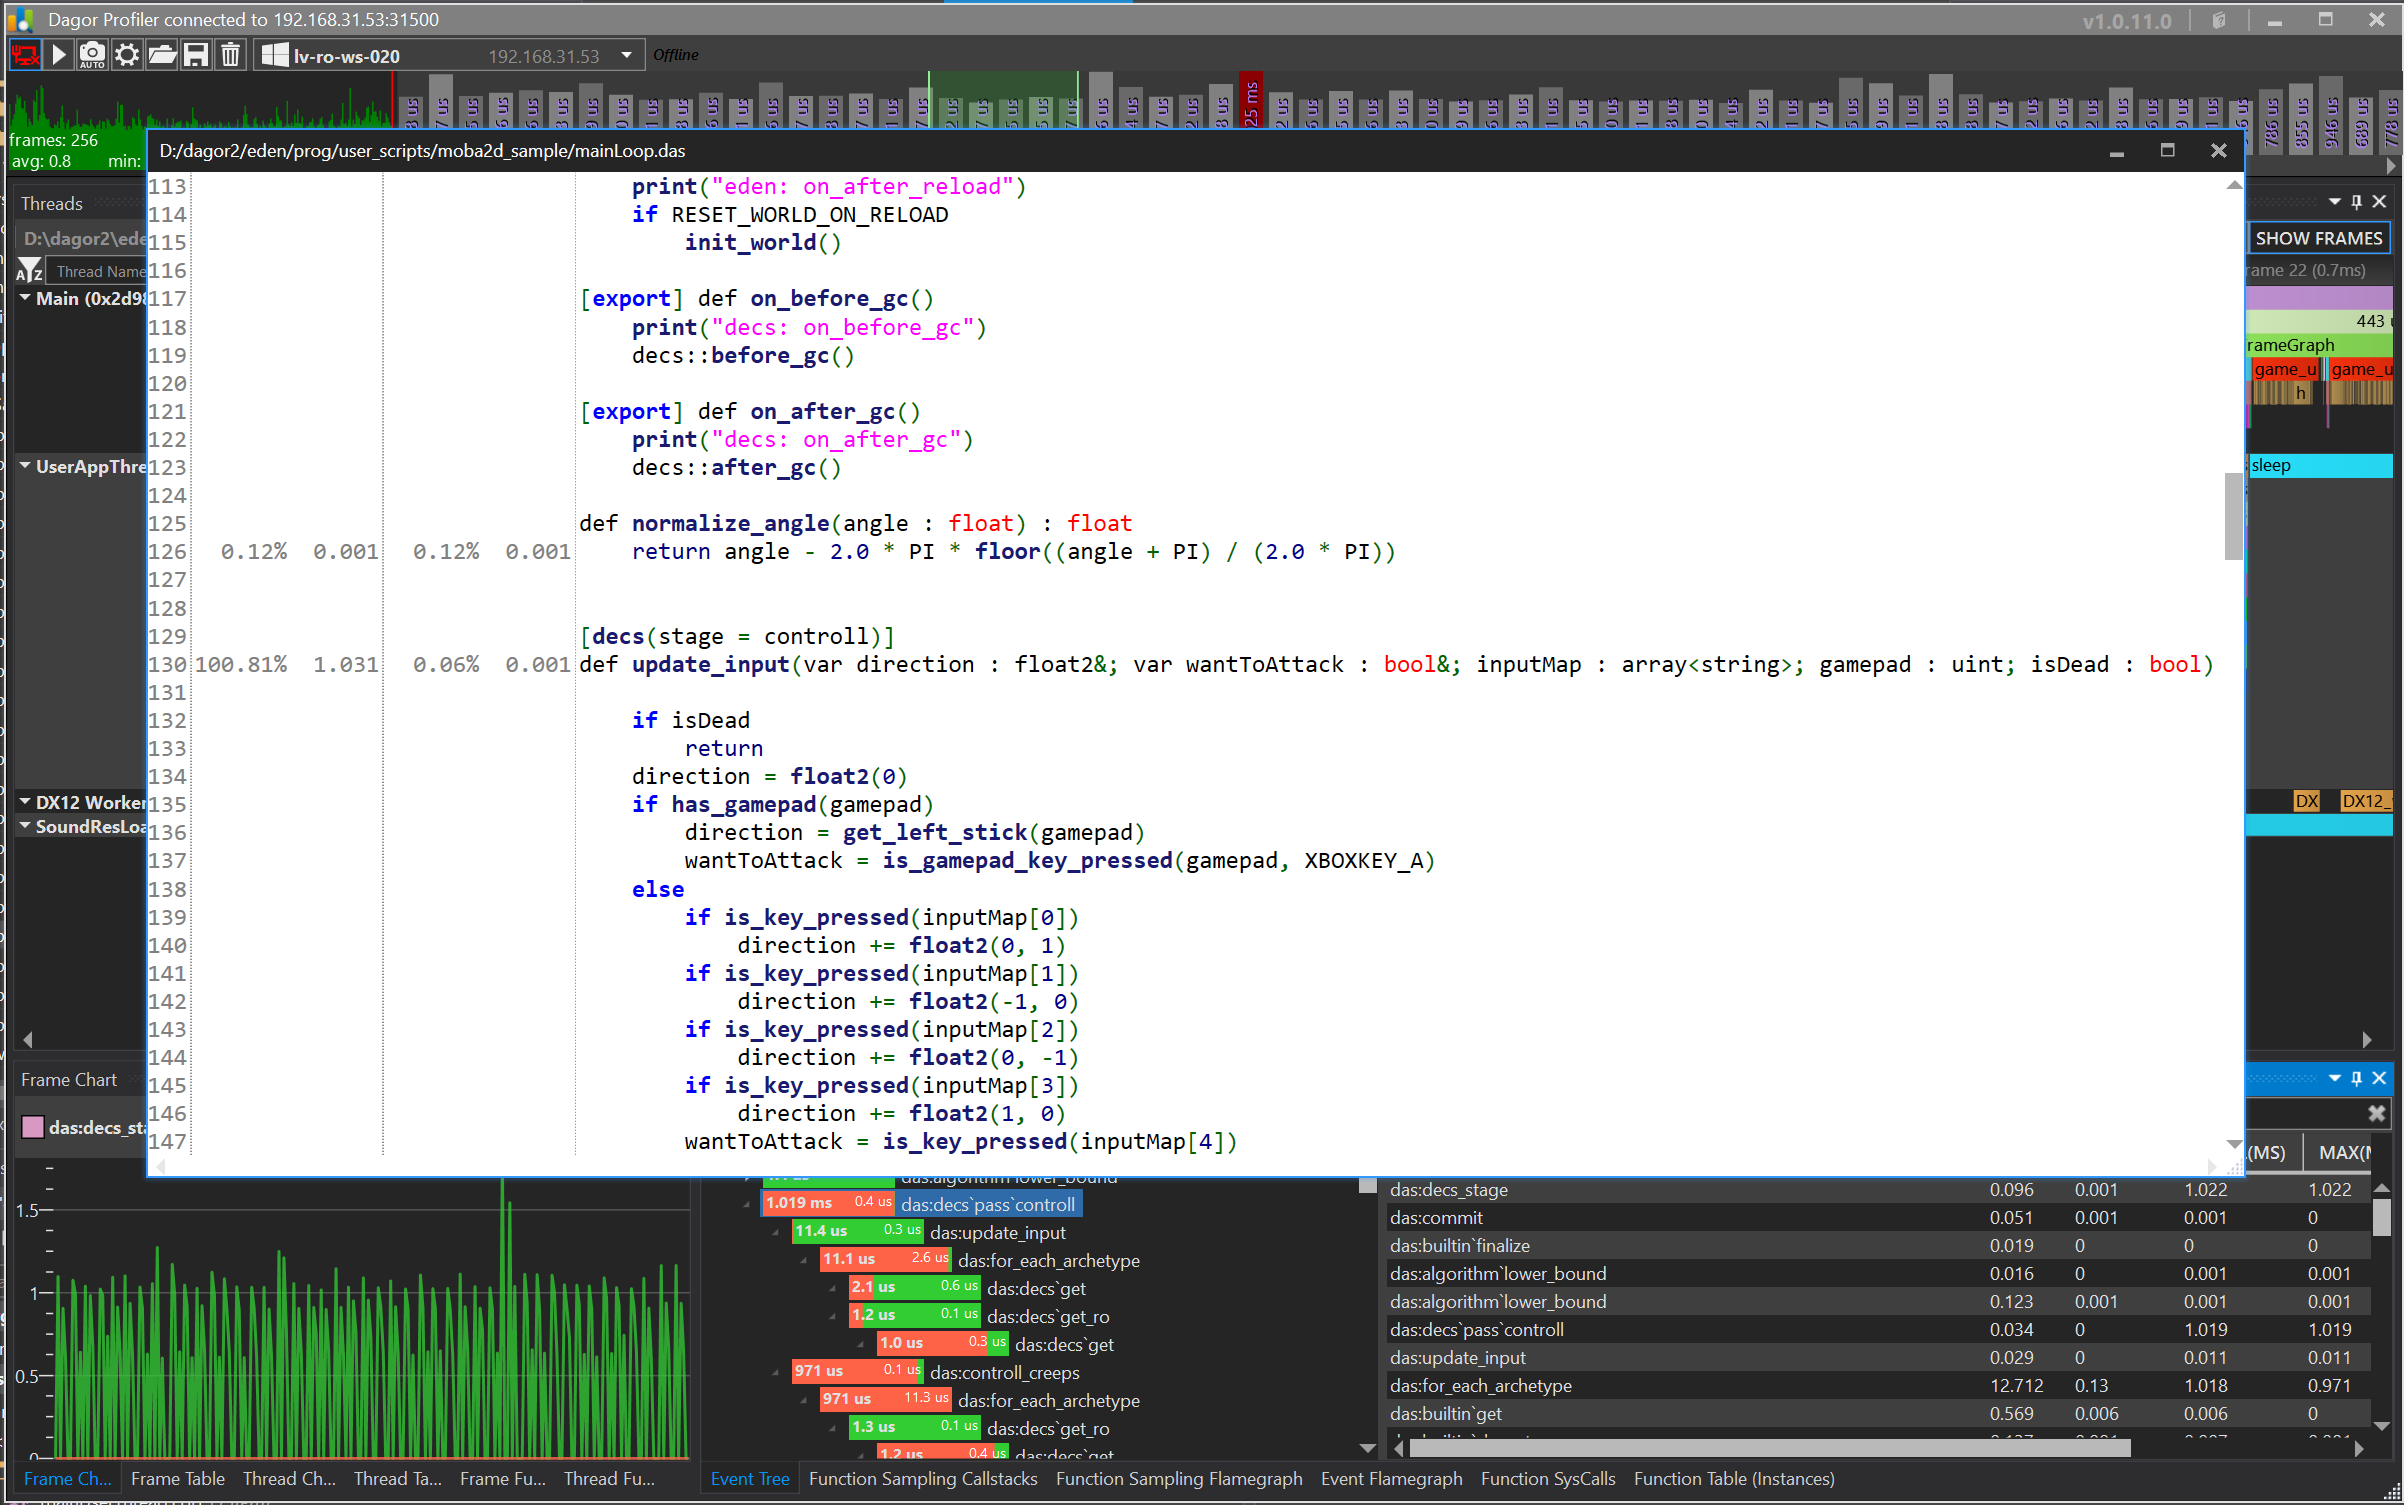
Open daProfiler and look for functions. All Daslang functions start with the “das:” prefix

You may use the Show Source Code button to open the *.das file directly in daProfiler.